Example: Sampling
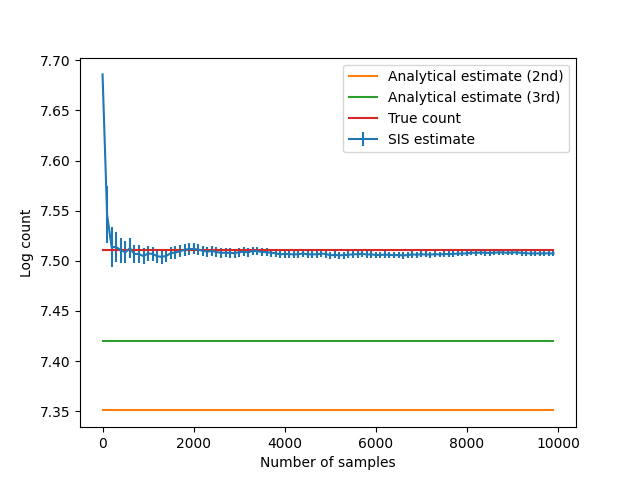
 1# Demonstration of how samples are combined to estimate the count
 2# of symmetric matrices with given margins.
 3# Produces a figure showing convergence to the true count.
 4
 5from __future__ import annotations
 6
 7import matplotlib.pyplot as plt
 8import numpy as np
 9
10import matrix_count as mc
11from matrix_count import _util
12
13test_margin = [3, 3, 3, 3, 2, 2]
14true_count = np.exp(7.51098) # Found with brute force
15
16num_samples = 10000
17
18# Estimate the number of matrices with given margins
19estimate_2 = mc.estimate_log_symmetric_matrices(test_margin, force_second_order=True)
20
21estimate_3 = mc.estimate_log_symmetric_matrices(test_margin)
22
23logEs = []
24log_count_err_ests = []
25
26entropies = []
27for t in range(num_samples):
28    if t % 100 == 0:
29        pass
30    sample, entropy = mc.sample_symmetric_matrix(test_margin)
31    entropies.append(entropy)
32    # log(Delta log E) = log(Delta E/E) = 1/2log(E2 - E^2) - 1/2 log(n) - log(E)
33    logE2 = _util.log_sum_exp(2 * np.array(entropies)) - np.log(len(entropies))
34    logE = _util.log_sum_exp(entropies) - np.log(len(entropies))
35    log_std = 0.5 * (np.log(np.exp(0) - np.exp(2 * logE - logE2)) + logE2)
36    log_count_err_est = np.exp(log_std - 0.5 * np.log(len(entropies)) - logE)
37    logEs.append(logE)
38    log_count_err_ests.append(log_count_err_est)
39
40entropies = np.array(entropies)
41
42plot_frequency = 100  # Number of samples between which to plot the result
43
44logEs = np.array(logEs)
45log_count_err_ests = np.array(log_count_err_ests)
46inds = np.arange(len(logEs), step=plot_frequency)
47plt.errorbar(inds, logEs[inds], yerr=log_count_err_ests[inds], label="SIS estimate")
48plt.plot(inds, estimate_2 * np.ones(len(inds)), label="Analytic estimate (2nd)")
49plt.plot(inds, estimate_3 * np.ones(len(inds)), label="Analytic estimate (3rd)")
50if true_count is not None:
51    plt.plot(inds, np.log(true_count) * np.ones(len(inds)), label="True count")
52plt.xlabel("Number of samples")
53plt.ylabel("Log count")
54plt.legend()
55plt.savefig("sample.png")